Artificial Intelligence applied to non-invasive blood analysis
Abstract
In this paper we investigate the capabilities of near-infrared (NIR) spectrometry and artificial intelligence (AI) in performing reliable, non-invasive blood analysis. We discuss the efficacy of near-infrared light in exploring the biological window, NIR spectrometry tools well suited for blood analysis and various data translation methodologies. We also explore AI methodologies - including various deep learning functions, regularization techniques and training methods - best equipped to accommodate big data collected through the pairing of NIR scan data and traditional blood test results. We then present a patented solution (Ferreira et al., 2017) in which NIR spectrometry and AI systems are combined to facilitate a new age of health awareness through the production of real-time blood biomarker predictions.
1. Introduction
Blood analysis without stress, without needles, without waste, no contaminant, in real-time, and made anywhere, could be possible? Traditional blood testing is riddled with limitations. Tedious procedures, painful sticks, extensive processing times and limited accessibility all contribute to the need for non-invasive blood analysis that provides utility to institutions and individuals alike. Pairing the capabilities of NIR spectrometry with carefully constructed AI systems can eliminate the need for current standardized blood testing practices, replacing it with non-invasive blood analysis that opens the door to a new standard of disease prevention, medical treatment and health awareness.
2. NIR Spectrometry and the Biological Response
Unlike other forms of light, near-infrared light (NIR) is capable of penetrating deep into soft tissue, muscles, joints and bones thanks to its unique optical window that maximizes transmission for wavelengths falling within the range of 650 nm to 1100 nm (Sakudo,2016). Unique characteristics make it possible for NIR to excite molecules that lie deep within live tissue. These characteristics include electromagnetic wavelengths ranging from 700 nm to 1mm, corresponding frequencies ranging from 430 THz to 300 GHz and a photon energy of 1.7eV to 1.24 meV (as depicted in figure 1).
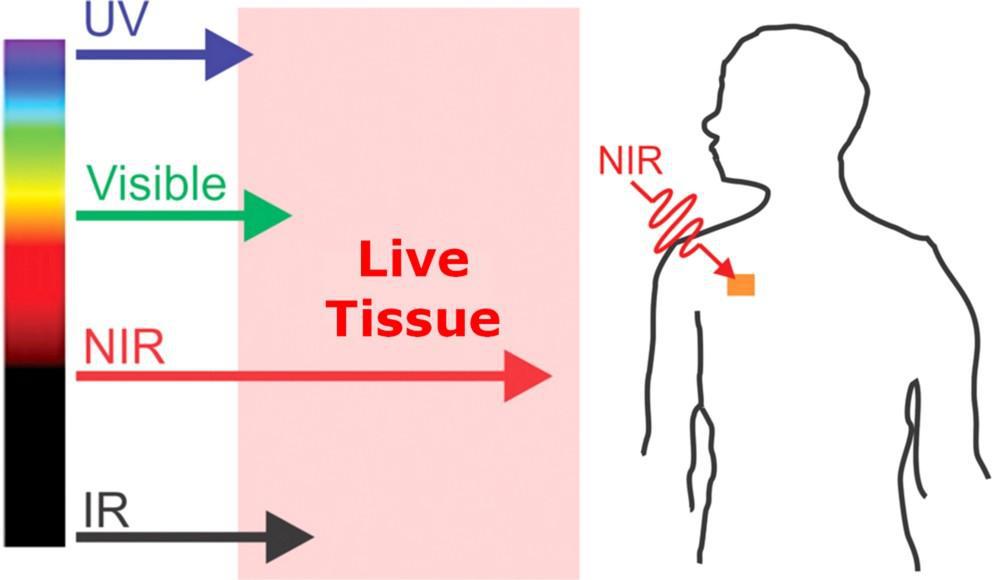
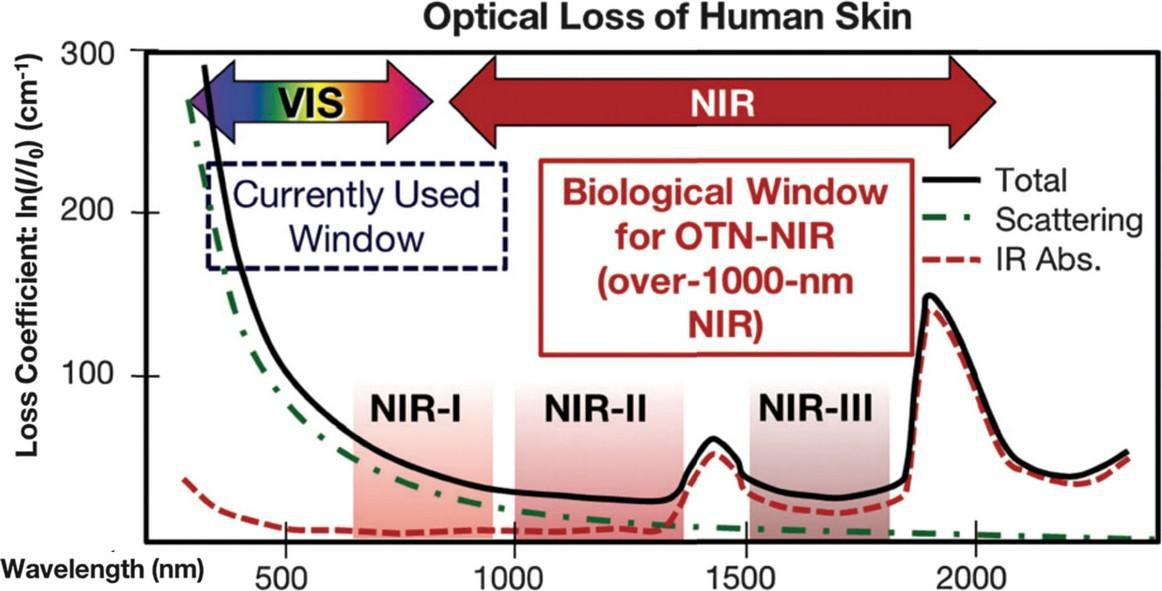
Figure 1 - NIR Biological Window
NIR’s ability to penetrate deep into live tissue makes it possible to observe the molecular vibrations that occur when organic compounds come into contact with NIR light. All organic compounds contain unique concentrations of carbon, and often substances like hydrogen, oxygen, nitrogen and sulfur. Upon exposure to NIR light, the bonds joining each atom experience molecular vibrations, creating unique combinations of overtone bands (spectral bands) as a result. Consequently, most organic compounds produce unique and observable
spectra when scanned with NIR wavelengths, paving the way for molecular identification.
Surpassing its theoretical applications, the use of NIR-spectrometry for the identification of pure, unencumbered compounds is alive and well. However, the complexity of the hemoglobin spectra previously prevented the use of NIR in the measurement of individual compounds found within more complex mixtures of blood and tissue (Wang et al., 2007). Recent advancements in the field of NIR spectral analysis make it possible to identify changes in spectral power (spectral perturbations) triggered by the concentration changes of a single compound, even amongst the shifting concentrations of other organic metabolites in the same sample.
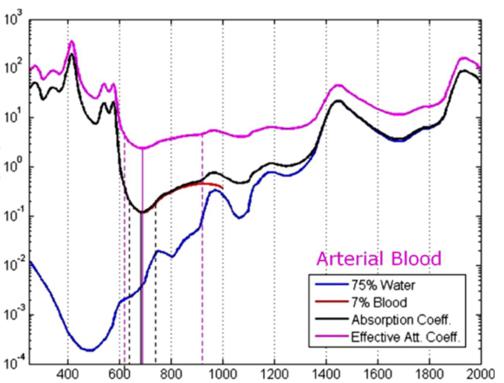
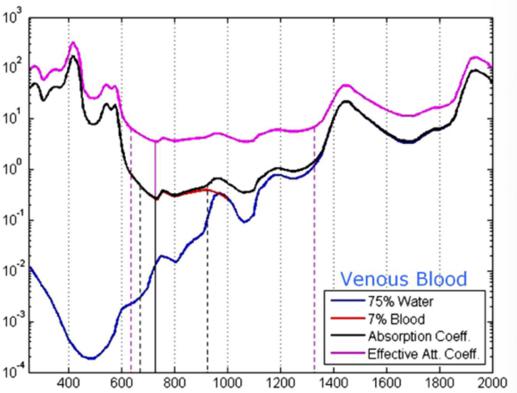
Barriers once considered a threat to the efficacy of deep tissue NIR-enabled readings - like skin color, fat or other potential interferents - are mitigated by NIR’s optimized optical window and unique interactions with NIR light. For example, melanin (skin coloration) has a linear reading and does not contribute significantly to NIR readings in comparison to other molecules. Likewise, the considerable density of fat has a specific signature, making it easy to detect and dismiss. Veins and arteries - as well as oxyhemoglobin (HbO2) and deoxyhemoglobin (Hb) widely present in blood - each possess unique and easily identifiable probabilities of photon absorption and are simply weeded out. NIR’s minimal absorption by water and hemoglobin, combined with marginal scattering in comparison to visual or ultraviolet light, allows the light to be effectively transmitted through the body without interference, making it the perfect medium for deep-tissue imaging (Hemmer et al., 2016). These essential NIR capabilities, visually depicted below in figures 2(a) through 2(f), make a powerful case for the effectiveness of NIR applications in exploring the biological window (Wang et al., 2007).
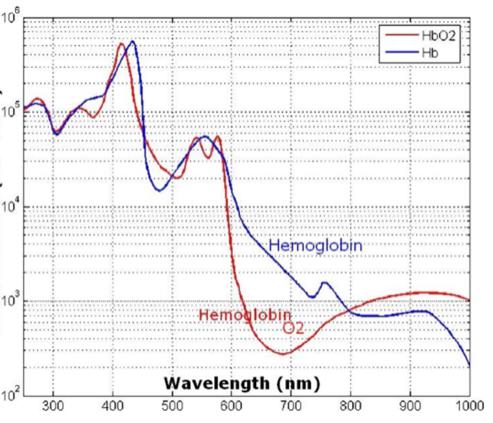
Molar ext. coef. (cm-1 M-1) Wavelength (nm) Fig. 2(a) Molar ext. of HbO2 and Hb
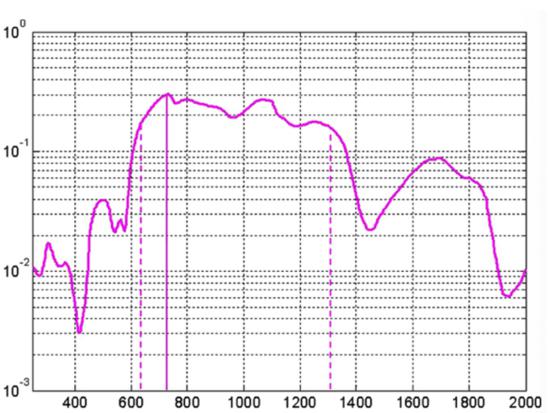
Effective penetration depth (cm) Wavelength (nm) Fig. 2(b) Effective penetration depth in tissue

Coefficient [cm^-1] Wavelength (nm) Fig. 2(c) Arterial spectra signature
Coefficient [cm^-1] Wavelength (nm) Fig. 2(d) Venous spectra signature
Absorption coefficient [m^-1] Wavelength (nm) Fig. 2(e) Fat spectra absorption
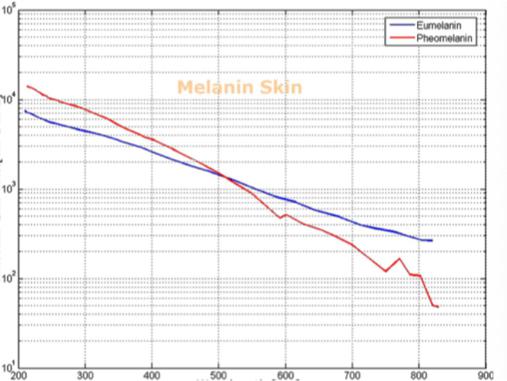
Molecular Ext. Coef. [cm-1 m-1] Wavelength (nm) Fig. 2(f) Skin melanin characteristics Figure 2 - Skin and Deep Tissue NIR works NIR Spectrometry Efficacy and Tools
Numerous NIR applications act as evidence of this new medium’s efficacy in measuring biological data. Among these current practices is the decades-old monitorization of oxygenation from live tissue - often taken in the form of a pulse oximeter fastened to the fingertip. Several publications throughout the 1990s demonstrated the accuracy of this method. Additionally, scientists at VIT University and Malaviya National Institute of Technology, Jaipur, recently presented a precise and non-invasive blood-glucose measurement system using NIR that manifests with an average accuracy rate of 94 percent in predicting blood glucose levels (Jain, 2019). Akikazu Sakudo, an associate professor at the University of the Ryukyus, also adds his voice to those above as he presents a compelling depiction of NIR’s current state and future potential to break down countless medical practice barriers (Sakudo, 2016).
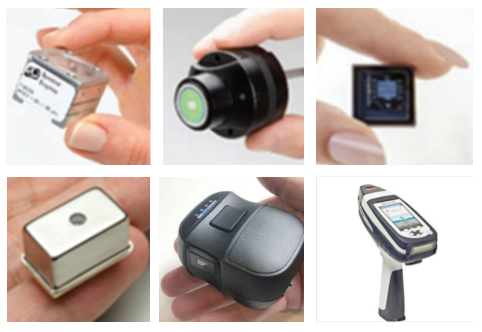
Figure 3 - Examples of Hand-Held NIR Devices
The practical applications of NIR spectrometry for non-invasive blood analysis require far more than a sound scientific foundation. Portable and stable NIR-enabled devices (see figure 3) make it possible to take advantage of NIR-detected biological data in nearly any use case. Scientist and researcher Richard Crocombe addressed this very consideration in his evaluation of portable, NIR-enabled devices (including technology like smartphones and consumer devices) that included both quantitative and qualitative factors across a variety of usage situations. He asserted that, depending on use case and accuracy requirements, these devices prove to have immense value (Crocombe, 2018).
2.1. NIR Spectrometry Data Translation Methodologies
Alongside his esteem for portable, NIR-enabled devices, Crocombe also stressed the need for reliable identification algorithms, spectroscopic databases and qualitative and quantitative calibrations to empower non-scientific users with coherent and actionable interpretations of spectra readings. Successful algorithms translate scan data into straightforward descriptions including substance identification and concentration.
The translation of scan data into layman’s terms of concentration is in part accomplished through the application of Beer-Lambert law, which asserts that the quantity of light absorbed by a substance dissolved in a fully transmitting solvent is directly proportional to the concentration of the substance. Expressed practically, Beer-Lambert law is: Absorbance = Molecular Absorptivity x
Path Length x Concentration
These calculations are exclusively derived from pure compounds without overlapping absorptions from interring substances. When working with more complicated samples, it’s necessary to account for interfering substances through the use of a multivariate equation. The Beer-Lambert law can then be rewritten as a multivariate equation:
I.C = k + ∑b(i).A(w(i))
where: (C) Concentration, (k) Constant,
(b) slope, (A) absorbance at the
wavelength (w)
To solve this multivariate equation, statistical regression analyses including principal component regression (PCR), partial least squares (PLS), and PLS discriminant analysis (PLS/DA) were implemented as early as the 1970s (Beebe et at., 1987; Brereton, 2000; Miller, 2018). Though the multivariate equation provides part of the solution, the unique case of live-tissue and blood analysis requires a sizable set of NIR-spectra readings for accurate data translation (Ferreira et al., 2017). The need for a large set of NIR spectra readings presents a problem that is difficult to solve through the multivariate equation (Beebe et al., 1987; Okut, 2016). The barriers presented here can be overcome by leveraging AI and its ability to transform big data inputs into small data answers; perfectly suiting the characteristics of live-tissue analysis.
The employment of NIR-spectrometry for non-invasive blood analysis is significantly limited without utilizing the capabilities of AI. With sufficient training, AI algorithms can learn to differentiate specific molecules and their concentrations by identifying overtone bands. The overtone band of each molecule is unique and, as discussed previously, results from a molecule’s exposure to NIR light. Due to the unique nature of each overtone band, molecules can be isolated by pairing each overtone band with its corresponding molecule within AI systems.
3. Artificial Intelligence Methodologies
Though a variety of AI deep learning methods exist, NIR-enabled blood analysis requires a fusion of modalities to satisfy the complexity of translating live-tissue spectra readings. Artificial neural networks (ANN), convolutional neural networks (CNN), evolutionary algorithms and fuzzy sets lay the foundation of such a task and are considered essential tools of AI (Martin & Jain, 1998). ANN - loosely based on the model of neurons in a biological brain - enables the use of necessary activation functions for the success of accurate data outputs, while CNN paves the way for image processing vital to the interpretation of spectra scans. Equally significant, evolutionary algorithms increase efficiency as they mirror the natural selection process and eliminate unfit members of the population data, while fuzzy sets allow room for the gradual assessment of elements in a set. This fusion successfully solves the problems associated with big data inputs to small data outputs; in this case, the prediction of blood biomarkers from a set of NIR-spectra readings.
3.1. AI Regularization Techniques
In order to avoid training an AI model prone to overfitting (becoming so specific during training that it cannot effectively make predictions on new data sets), a regularization technique known as Bayesian regularized ANN (BRANN) can be applied. BRANN works through Levenberg-Marquardt optimization by making slight modifications to the learning algorithm, resulting in a model that generalizes more effectively. Ultimately, BRANN prioritizes some aspects of a dataset while penalizing large weights (making them smaller) to achieve smoother mapping and avoid overfitting. A group of scientists at Metron Inc. demonstrated the efficacy of this statistical technique when successfully employing it to find the wreckage of flight AF447; an Air France flight that disappeared over the Atlantic roughly three years before its discovery. The scientists considered the BRANN approach to be foundational in the success of the mission (Stone et al., 2014).
In the pursuit of accurate ANN model predictions, high-dimensional data (like NIR spectra scans) threaten to make calculations extremely difficult. Scientists from the Colegio de Postgraduados in Montecillo, Mexico and University of Wisconsin-Madison developed an open-source software model prepared to manage high-dimensional data (Pérez-Rodríguez, 2013). Their approach utilities the R package for the BRANN method, effectively extending the method to include both additive
and dominance effects of the input data. The software successfully fit models with an additive genomic relationship matrix of up to 2500 X 2500 individuals with excellent performance in terms of time and accuracy.
Practical applications of the aforementioned ANN model include experimental research conducted by scientists at the Université de Tunis in Tunisia, who proposed an ANN model capable of predicting blood glucose levels to detect hyperglycemia or hypoglycemia 15 minutes in advance (Hamdi, 2017). Researchers began by defining the optimal architecture of an ANN, then utilizing the structure as a reference point to achieve an accurate prediction model. They then applied the Clarke Error Grid Analysis to assess the clinical significance of differences between glucose measurement techniques, showcasing the accuracy of the predictions. Their research also considers an automatic way to define a base ANN architecture as a starting point for building a set of ANNs that act as a population.
3.2. AI Training Methods
In the effective training of ANNs, it is often necessary to deploy a variety of techniques that mitigate excessive computational effort and overfitting, while encouraging appropriately timed early stopping. These methods ensure that models built on training sets maintain the required level of generalization and avoid overtraining for accurate predictions when tested on a validation set.
Despite its usefulness as an effective optimization tool for ANNs, the Levenberg-Marquardt algorithm could have an untimely early stop when the dataset has a higher number of observed variables than it does sample size, resulting in faulty solutions. To delay the timing of an early stop for increased accuracy, the additional evaluation of a fitness function for cross-validation is required. We consider cross-validation called “Error-index” to classify the prediction quality of an ANN optimizing the R2 correlation and the maximum perceptual error from the prediction and sample (see figure 7).
Furthermore, after some simulation and consideration of using the method of starting an ANN’s architecture as proposed in the First International Symposium In Control, Communications and Signal Processing (Fnaiech et al., 2004), we chose the hyperbolic tangent for the hidden layers as activation functions - because of the saturation - taking the study described by scientists Xavier Glorot and Yoshua Bengio into account that analyzes the behavior of a sigmoid activation function (Glorot, 2010).
In the solution space, the ideal distribution of ANNs (as illustrated in figure 4) increases the probability of getting close to an optimal solution while avoiding untimely early stopping. The ANNs are created by randomly defining the synapses’ weight, or the W matrix of neuron connections and their biases. In their work on improving neural network learning speed through choosing the initial values of adaptive weights, Derrick Nguyen and Bernard Widrow establish a methodology for choosing these weights (Nguyen, D. 2008). Due to the current work’s use of ANNs with more than two layers and non-linear activation functions, this initialization process was applied with success.
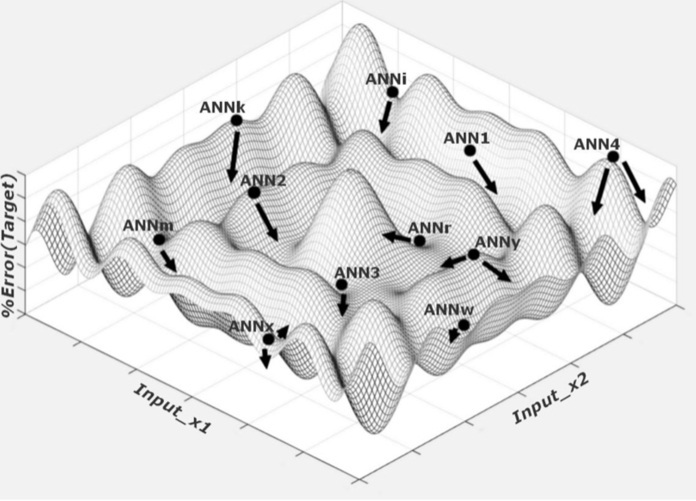
Figure 4 - ANN Population (Solution space)
4. Operational process
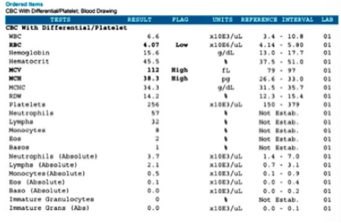
The patent (Pereira et al., 2017) paves the way for the successful application of the NIR and AI concepts outlined above and lays the foundation of this unique methodology for non-invasive, real-time blood biomarker predictions. The first step includes the creation of a database (depicted in figure 5) which pairs together NIR scan data with its corresponding blood sample containing the concentrations of various blood biomarkers. Ultimately, the database structure is composed of three elements: the patient identification number, the NIR spectra reading and its corresponding blood analysis results.
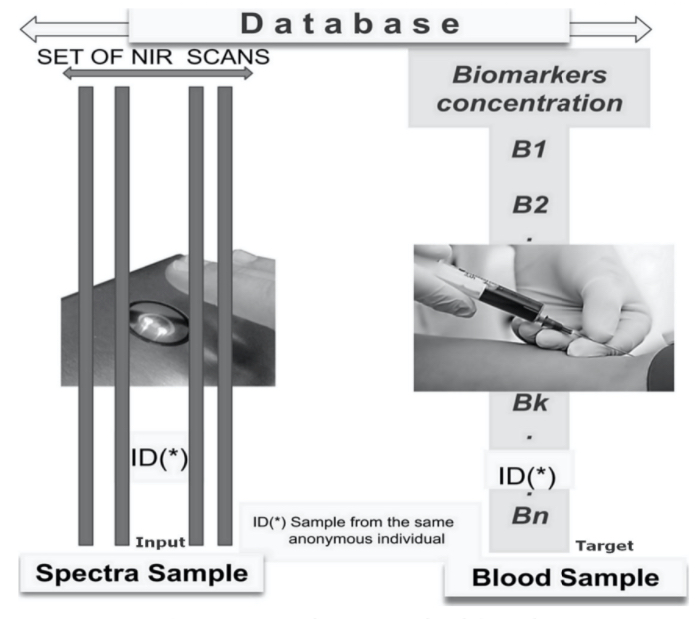
Figure 5 - Database NIR Blood Sample
Prior to inputting data into the database, patients are invited to donate conventional blood biomarker samples alongside an NIR-spectra reading in a clinical environment. Best practices in ethics and patient privacy protocols are strictly adhered to, and each patient fills out an “informed consent” form prior to the collection of the blood sample and NIR scan. In order to achieve an NIR scan most reflective of the associated blood sample, both the scan and sample are collected within 15 minutes of one another to mitigate metabolic variations occurring between collections and limit variation within the dataset.
A variety of database factors have the power to influence prediction accuracy moving forward, including the number of NIR channels (n), scan exposure time, and the size of the database. As depicted in figure 6, the number of NIR channels and exposure time plays a significant role in the complexity of calibrating input-X (NIR scan data) with target-Y (conventional blood analysis results) through multivariate analysis (Brereton, 2000). The database must be large enough to train an ANN system capable of distinguishing the relationship between NIR spectra and blood samples. Depending on the desired application - whether it be a medical screening or medical diagnosis - between one and ten thousand samples are required to ensure reliable prediction quality (see figure 9).
| ID Keys | A set of filtered curves in n channels from 900 – 2500 nm | Conventional Blood Analysis Results (Y-targets) |
| Patient ID(only number) NIR device S.number and model, temperature, standard deviation, Savitzky–Golay deviation, exposure time, etc. NIR Spectra (X-inputs) |
|
|
| Figure 6 - Primary Database Structure from Figure 5 | ||
After preprocessing the database depicted in figure 6, outliers with compromised results are discarded. These include readings impacted by temperature, inconsistencies and other variables. Following this vetting process, NIR data (X) and blood results (Y) are applied to an AI system. At this point, the application of AI mitigates the barriers of defining topology, activation functions, weights initialization, depth, mathematical optimization techniques and training methods. Next, datasets are introduced within an ideal ANN initialization process (depicted in figure 4). This process utilizes the same dataset and goal within multiple ANNs differentiated by structure or training algorithms. Referred to as a “population,” this set of ANNs with identical datasets but unique definitive characteristics increases the probability of achieving the optimal solution. A genetic algorithm is then applied to search the space of potential solutions and find the best solution, as depicted in figure 7.Prior to running the AI algorithm (simplified for depiction in figure 7), the data set is divided into two parts: the training set (XT, YT) and the validation set (XV, YV). The training set includes 80 percent of the data (equal parts NIR scan and blood results) while the validation set includes only 20 percent and is excluded from the training algorithm. Each ANN’s ability to process independently enables the execution of parallel computing (figure 7, steps 1 and 2), allowing the ANNs to operate simultaneously for optimized computing time. To evaluate the quality of each ANN, a fitness function (figure 7, step 3) uses a single figure of merit to summarize how closely the designed solution is to achieving the desired output, falling between the maximum error and R2 measures. The fitness function evaluates using the validation set (XV, YV) in an effort to detect and avoid overfitting.
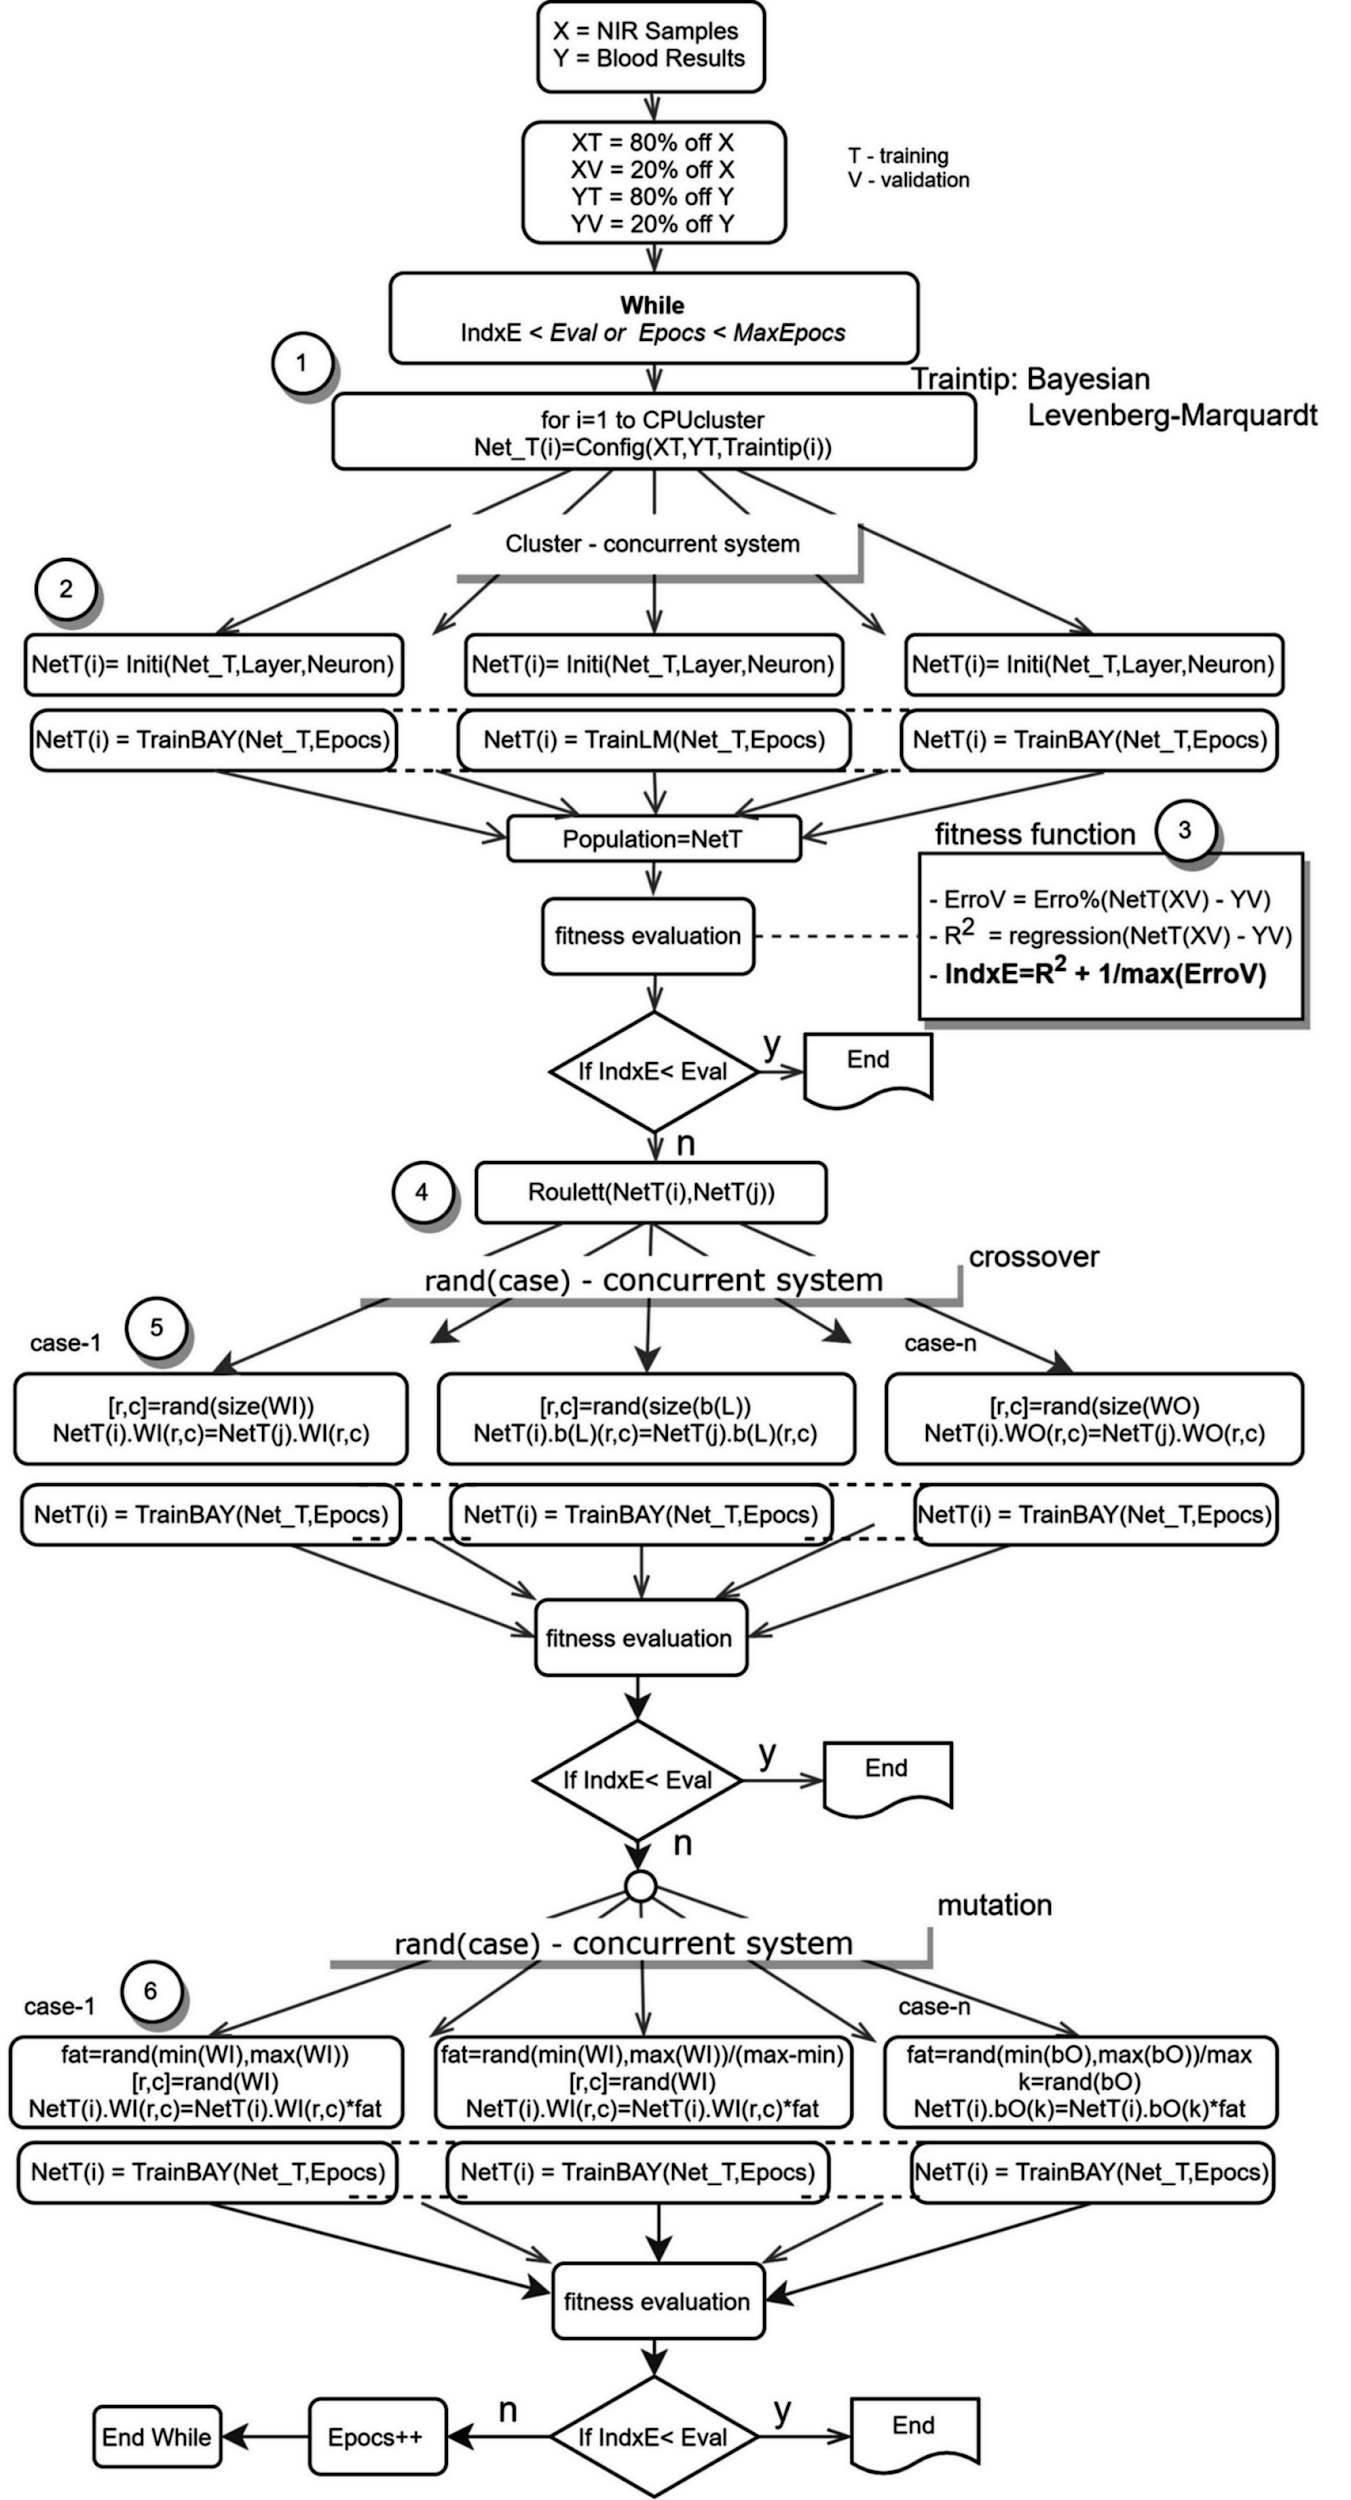
Figure 7 - Artificial Intelligence Training Algorithm (Simplified)
The AI training system finishes when the fitness function is less than a predetermined limit or when the maximum epochs (updates to internal model parameters) are reached. Next, the model applies a genetic algorithm (figure 7, steps 4-6) in the form of crossover, mutation and natural selection that mimics biological evolution.
4. Results
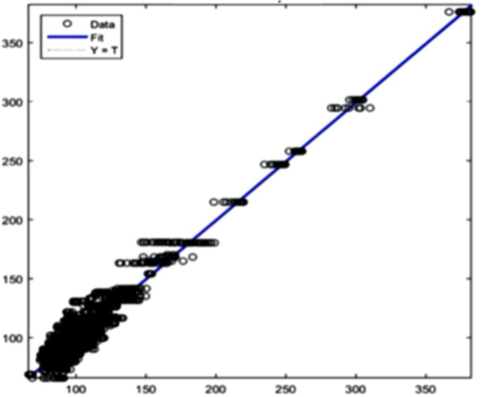
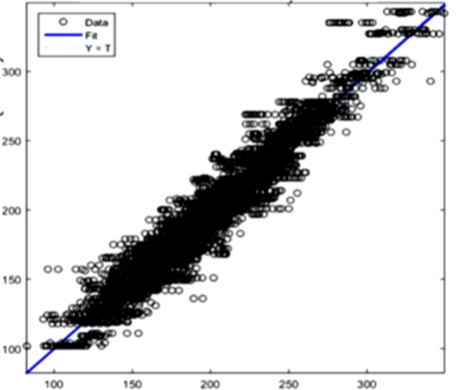
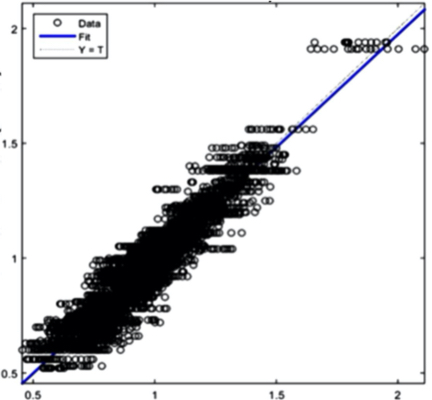
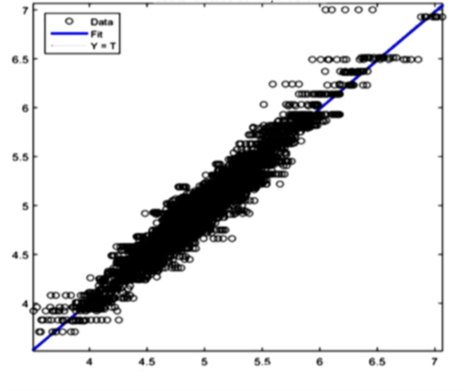
The AI training system described above proves itself to be highly efficient, as demonstrated in figure 8’s depiction of glucose, cholesterol, hematocrit and creatinine concentration predictions. Figures 9(a) and 9(b), however, depict problematic outcomes following the execution of the AI algorithm. In this case, the samples (NIR scan and associated blood results data) did not represent an adequate biomarker concentration distribution, as they do in figures 9(c) and 9(d), lacking the widely spread representation required for the accurate calibration of NIR scans and biomarker results (For all results: Calculated results (20%) x Conventional result YV (20%)).
Glucose: R2 = 0,96537 Figure 8(a) Glucose prediction
Cholesterol: R2 = 0,95945 Figure 8(b) Cholesterol prediction
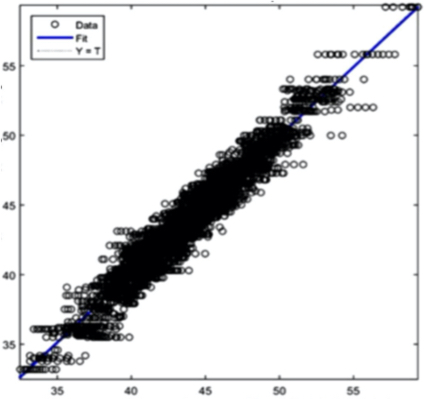
Hematrocit: R = 0,96683 Figure 8(d) Hematocrit prediction
Creatinine: R=0,94048
Figure 8(e) Creatinine prediction Figure 8 - Example Results from the AI Training System
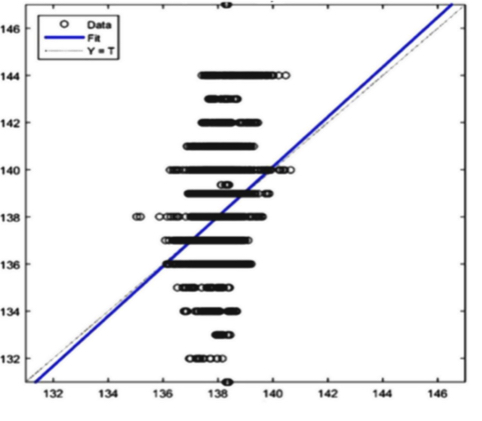
Sodium: R=0,23697
Figure 9(a) Uncalibrated result Sodium
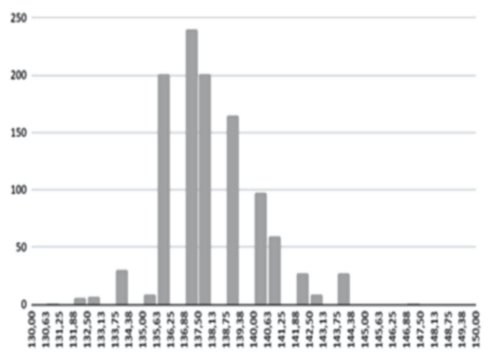
Figure 9(b) Main reason for bad calibration
Red Cells: R=0,96766
Figure 9(c) Calibrated result Red Cells
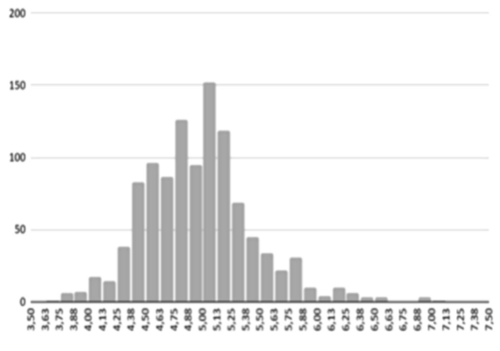
Figure 9(d) Well distributed samples
Figure 9 - Quality of the Sample Distribution
4. Conclusion
The fusion of near-infrared spectrometry and artificial intelligence for non-invasive blood analysis shows immense promise in both theory and practical application. The unique properties of NIR light - combined with strategically formulated data translation methodologies - provides a necessary part of the solution. This - coupled with a combination of AI deep learning methods and algorithms including ANN, CNN, evolutionary algorithms, fuzzy sets and various regularization techniques - lays the technical framework for the successful execution of non-invasive blood analysis.
Within this framework, our patent encompasses the collection of biodata for the creation of a database which pairs patients’ NIR scan data with corresponding blood samples; all conducted with the utmost regard for patient privacy. Following the thorough vetting of unfit data and division of datasets into a training set and validation set, scan and blood results are applied to an AI system strategically configured utilizing an ideal ANN initialization process with multiple ANNs differentiated by structure or training algorithms. The evaluation of each ANN is conducted with the help of a fitness function and genetic algorithm.
We’re confident in the efficacy of the NIR spectrometry and AI methodologies presented in this paper and employed by our patent, and are prepared to overcome barriers presented by the necessity of gathering an adequate biomarker concentration distribution with widely spread representation.
References
Aggarwal, C. (2018). Neural networks and deep learning: A textbook. Cham, Switzerland: Springer.
Beebe, K. R., & Kowalski, B. R. (1987). An introduction to multivariate calibration and analysis. Retrieved from https://pubs.acs.org/doi/abs/10.1021/ac00144a001
Brereton, R. G. (2000, October 31). Introduction to multivariate calibration in analytical chemistry. Retrieved from https://pubs.rsc.org/en/content/articlelanding/2000/an/b003805i#!divAbstract
Crocombe, R. A. (2018) Portable Spectroscopy. Applies Spectroscopy, 72(12), 1701-1751.
doi:10.1177/0003702818809719
Fnaiech, N., Abid, S., Fnaiech, F., & Cheriet, M. (2004). "A modified version of a formal pruning algorithm based on local relative variance analysis," First International Symposium on Control, Communications and Signal Processing, Hammamet, Tunisia, 2004, pp. 849-852, doi: 10.1109/ISCCSP.2004.1296579.
Fnaiech, N., Fnaiech, F., & Cheriet, M. (2002). A new feedforward neural network pruning algorithm: SSM-iterative pruning (SSMIP). IEEE International Conference on Systems, Man and Cybernetics, 4, 6 pp. vol.4-.
Glorot, Xavier & Bengio, Y. (2010). Understanding the difficulty of training deep feedforward neural networks. Journal of Machine Learning Research - Proceedings Track. 9. 249-256.
Hemmer, E., Benayas, A., Légaré, F., & Vetrone, F. (2016). Exploiting the biological windows: Current perspectives on fluorescent bioprobes emitting above 1000 nm. Nanoscale Horizons, 1(3), 168-184. doi:10.1039/c5nh00073d
Jacques, S. (2018). Extinction Coefficient of Melanin. Retrieved from https://omlc.org/spectra/melanin/extcoeff.html
Jain, P., Maddila, R., & Joshi, A. M. (2019). A precise non-invasive blood glucose measurement system using NIR spectroscopy and Huber’s regression model. Optical and Quantum Electronics, 51(2). doi:10.1007/s11082-019-1766-3
Kramer, O. (2017). Genetic algorithm essentials. Cham: Springer.
Martin, N. M., & Jain, L. C. (1998). Fusion of neural networks, fuzzy systems, and genetic algorithms: Industrial applications. Boca Raton, FL: CRC Press.
Maynard, M. (2020). Neural Networks: Introduction to Artificial Neurons, Backpropagation and Multilayer Feedforward Neural Networks with Real-World Applications. Independently published.
Miller, J. N., Miller, J. C., & Miller, R. D. (2018). Statistics and chemometrics for analytical chemistry. Harlow, England: Pearson.
Nguyen, N., Jeon, K., Lee, J., & Byun, Y. (2008, April). Design Optimization Process Using Artificial Neural Networks, Bayesian Learning and Hybrid Algorithm. Retrieved from ResearchGate. doi: 10.2514/6.2008-1976
Nguyen, D., & Widrow, B. (1990). Improving the learning speed of 2-layer neural networks by choosing initial values of the adaptive weights. 1990 IJCNN International Joint Conference on Neural Networks, 21-26 vol.3.
Okut, H. (2016). Bayesian Regularized Neural Networks for Small n Big p Data, Artificial Neural Networks - Models and Applications, Joao Luis G. Rosa, IntechOpen, doi: 10.5772/63256.
Pérez-Rodríguez, P., Gianola, D., Rosa, G., & Weigel, K. (2013). Technical Note: An R package for fitting Bayesian regularized neural networks with applications in animal breeding. Journal of Animal Science.
doi: 10.2527/jas.2012-6162
Ferreira, V.P., Martins, J.A., Pereira, M. (2017). Sampler and method of parameterizing of digital circuits and of non-invasive determination of the concentration of several biomarkers simultaneously and in real time. 20180037929.
Prahl, S. (1999). Optical Absorption of Hemoglobin. Retrieved from https://omlc.org/spectra/hemoglobin/
Sakudo, A. (2016). Near-infrared spectroscopy for medical applications: Current status and future perspectives. Clinica Chimica Acta, 455, 181-188. doi:10.1016/j.cca.2016.02.009 Stone, L. D., Keller, C. M., Kratzke, T. M., & Strumpfer, J. P. (2014, May 19). Search for the Wreckage of Air France Flight AF 447. Retrieved from https://arxiv.org/abs/1405.4720v1
Hamdi, T. et al., "Artificial neural network for blood glucose level prediction," 2017 International Conference on Smart, Monitored and Controlled Cities (SM2C), Sfax, 2017, pp. 91-95, doi: 10.1109/SM2C.2017.8071825.
Vo-Dinh, T. (2015). Biomedical photonics handbook. Boca Raton: CRC Press/Taylor & Francis Group.
Wang, L. V., & Wu, H. (2007). Biomedical optics: Principles and imaging. Hoboken, NJ: Wiley-Interscience.